All Posts By

Tony Glover

The madness of markets

The madness of markets

As an investor, it is generally not a bad idea to ignore what is going on in your portfolio most of the time.  At the very least it can be distracting and at worst it can be a source of unnecessary anxiety.  That advice is as applicable today as it ever was.

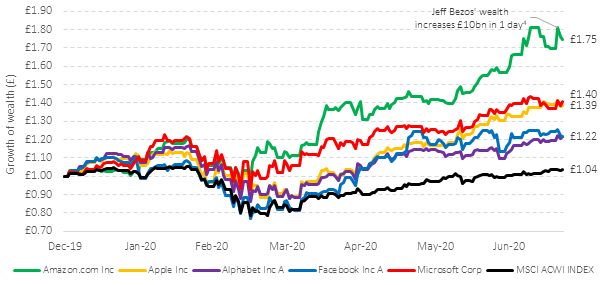
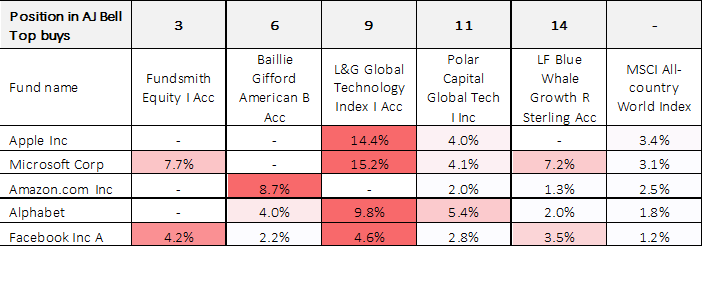
The markets feel like they have gone a bit mad!  Since the start of the pandemic – and despite a 25% or so fall in late February and early March – global markets (developed and emerging combined) have gone up by more than 10%[1].  Some sectors and companies have delivered far higher returns.  For example, the ‘FAANGs’ (Facebook, Apple, Amazon, Netflix, and Google) – all beneficiaries of global lockdowns – have risen collectively by 45% since the pre-pandemic market high[2]. In May 2020, Elon Musk, Telsa’s CEO, tweeted that its share price was too high, and it fell 10% overnight to US$80, yet Tesla’s share price has, since then, grown almost ten-fold to $804 on 10th February 2021.  Today Tesla’s market capitalisation is now larger than the next nine global car manufacturers combined, including Honda, VW, Renault-Nissan, and GM[3].  Let’s not even mention Bitcoin!  Are these fair prices or are they overvalued?

The rational investor would say that the market is simply looking beyond the pandemic and to a time of global recovery and a more normal world and that the market is the best judge of prices.  Yet some investors may have concern that markets are in a bubble and question if they should reduce their equity holdings.  Others may see the extraordinary returns from a certain sectors and companies and feel a sense of FOMO (fear of missing out) that they are not more heavily invested in tech stocks or Tesla, for example.  The problem is that the markets may be right…or wrong.  The one thing we know for sure is that it is impossible to know which with any certainty, and the evidence tells us that even professionals have little ability to time entry into or out of stocks, sectors, or markets successfully.  Markets can remain seemingly mad for a long time.  As John Maynard Keynes famously once said:

“Markets can remain irrational longer than you can remain solvent.”

Sensible investing is about remaining highly diversified across markets, sectors, and companies to avoid absolute losses and to try to smooth out returns as much as possible over time. To many that is a great comfort and allows them to sleep at night.  Rebalancing periodically and reminding yourself that you do not need to cash in your equity assets in the near term is worthwhile.  It may not be as exciting as punting (which is what it is) on Tesla or Bitcoin, but it will reap its rewards over time.  Remember too that by being diversified means that you will benefit from being in the companies and sectors that do well.  In 2020, the developed global stock markets returned around 12% in GBP terms.  Of this 12%, half – or an absolute 6% – of this return was attributed to the top 10 stocks.  The FAANGs alone represented 30% (i.e. around 4% of the 12%)[4].  That is surely enough exposure for most.  Stick with the plan and try not to look at, or think about, your portfolio too much.  Attempting to second guess the market is a fool’s errand.

Risk warnings

This article is distributed for educational purposes and should not be considered investment advice or an offer of any security for sale. This article contains the opinions of the author but not necessarily the Firm and does not represent a recommendation of any particular security, strategy, or investment product.  Information contained herein has been obtained from sources believed to be reliable but is not guaranteed.

Past performance is not indicative of future results and no representation is made that the stated results will be replicated.

Use of Morningstar Direct© data

© Morningstar 2020. All rights reserved. The information contained herein: (1) is proprietary to Morningstar and/or its content providers; (2) may not be copied, adapted or distributed; and (3) is not warranted to be accurate, complete or timely. Neither Morningstar nor its content providers are responsible for any damages or losses arising from any use of this information, except where such damages or losses cannot be limited or excluded by law in your jurisdiction. Past financial performance is no guarantee of future results.

[1] MSCI ACWI Index in GBP terms from 19/02/2020 to 10/02/2021

[2] https://uk.tradingview.com/chart/?symbol=FX%3AFAANG in USD

[3] https://www.researchaffiliates.com/en_us/publications/articles/819-tesla-the-largest-cap-stock-ever.html

[4] GSI (2021), The recent performance of Growth and Value.

Bitcoin and bandwagons

Bitcoin and bandwagons

In the past few months, it might appear – at least to some – that making money in markets is easy – just buy Tesla or Bitcoin and you are sure to double your money! That is to confuse gambling with investing, and these are certainly not recommendations by the way.

Bitcoin – boom, bubble or bust?

In October 2008, a mysterious white paper was published by an unknown author titled “Bitcoin: A Peer-to-Peer Electronic Cash System[1] and the world had been introduced to its first ‘cryptocurrency’. Driven by blockchain technology, the main attraction compared to traditional currency was clear – Bitcoin provides a decentralised way for two parties to exchange value. In other words, Bitcoin has no need for a governing body, no central bank and is merely a digital ledger that facilitates and records transactions. Without getting too granular about how exactly this works, the complicated mathematical procedures in place make falsifying Bitcoin transactions unlikely with today’s technology[2] (although never say never!).

Figure 1 The cryptocurrency market value is small relative to the global equity market

Data source: CoinMarketCap.com, MSCI ACWI Factsheet. Figures as at 28/01/2021.

Twelve years down the line the cryptocurrency space has seen thousands of alternatives, or ‘altcoins’, come to market, all of which attempt to improve upon the blueprint pioneered by Bitcoin. One challenge is scalability – Bitcoin can handle a paltry 350,000 daily transactions[3] compared with VISA who executed ≈500m per day in 2019[4]. Furthermore, in a society that is ever more focused on sustainability, a currency that requires enormous warehouses full of energy-hungry computer equipment to keep it going, feels like a square peg in a round hole. A useful tool built by the University of Cambridge estimates that the Bitcoin network currently consumes around 110 TWh of energy per year, roughly the same as the Netherlands[5]!

Despite the implementation issues, the value of Bitcoin – and many of the ‘altcoins’ mentioned previously – have skyrocketed of late leading to a lot of excitement for investors (or rather gamblers). The only thing we know for certain about investing in cryptocurrency is that it is highly speculative. The extraordinary volatility of most ‘coins’ makes them an unreliable store of value. Going to sleep and waking up 10% richer (or poorer) is commonplace. Furthermore, Bitcoin is not a capital asset – it does not pay dividends, nor does it have a positive expected return. Positive outcomes are simply the result of demand outstripping supply, although investors are quick to forget that the future expectation of demand is already factored into the current price. There are 18.6 million Bitcoins in existence, yet recently the sale of 150 Bitcoins resulted in a price drop of 10%[6] demonstrating no depth or liquidity to the Bitcoin market.

It is possible that we may one day transition to a world where cryptocurrency is adopted by the masses. Who knows if that is even remotely likely, and better yet who knows which cryptocurrency will be the one that ticks all the boxes? As an investment today, cryptocurrency plays no role in portfolios and any investor (gambler) should be willing to accept a maximum loss of 100%.

Here is another example of gambling masquerading as investing:

GameStop – reddit vs Wall Street

In what is a fast-moving situation, a group of amateur investors using discussion website reddit as a platform, have banded together to take on the professional hedge fund space in the US. The group has focused their conversation on a few stocks of late, the most recent of which is an American consumer electronics firm, GameStop. On the one side we have the hedge fund managers, who are engaged in a process known as ‘shorting’, essentially betting that the share price of GameStop will go down over time. A successful short involves borrowing stock from a third party, selling it on the marketplace and then buying it back later when the price has fallen. This allows the short seller to return the stock to the third party and cash in the difference in price. The danger of this is that if prices were to rise, purchasing the stock back becomes more and more expensive for the short seller and they cannot afford to return their borrowed stock. Professional investors are aware of these risks more than anyone.

The companies featured recently on the forum are heavily shorted and include GameStop, AMC Entertainment, Koss Corp and Blackberry (throwback). By purchasing shares in these firms, investors are bidding up prices creating huge losses for some of the hedge fund managers. These are not small market movements either. As of the 27th of January, the share price of GameStop closed nearly 2000% up since the start of the year[7]. Yet in the time it has taken to write this article, on 28th January the price fell by almost a half! A quick glance at the forum shows that the motivation for some is to ‘stick it to the man’, whereas others are perhaps looking to make a quick buck. As the situation progresses it has certainly caught the eye of the regulator on suspicion of market manipulation, as well as the newly appointed US Treasury Secretary, Janet Yellen, whose team are “monitoring the situation”[8].

Either way, it is difficult to see how this will have any sort of happy ending. Other than the handful of investors (gamblers) who might sell at the right time, the only guaranteed beneficiaries to all this are the market makers and middlemen. If you want excitement, just follow the stories, and enjoy the schadenfreude that follows. This is just gambling and best avoided.

Risk warnings

This article is distributed for educational purposes and should not be considered investment advice or an offer of any security for sale. This article contains the opinions of the author but not necessarily the Firm and does not represent a recommendation of any particular security, strategy, or investment product.  Information contained herein has been obtained from sources believed to be reliable but is not guaranteed.

Past performance is not indicative of future results and no representation is made that the stated results will be replicated.

[1] Bitcoin.org (2008) Bitcoin: A Peer-to-Peer Electronic Cash System.

[2] Forbes (2020) Can All of Bitcoin Be Hacked?

[3] Research Affiliates (2021) Bitcoin: Magic Internet Money.

[4] Statista (2019) Number of purchase transactions on payment cards worldwide in 2019.

[5] University of Cambridge (2021) Bitcoin Electricity Consumption Index

[6] Jemma Kelly (07 Jan 2021), No, bitcoin is not “the ninth-most-valuable asset in the world” Time for some realism. FT.com

[7] Google Finance (2021) GameStop Corp. Share price.

[8] BBC News (2021) GameStop: Amateur investors continue to outwit Wall Street.

Equity markets and US Presidents

Equity markets and US Presidents

The final days of Donald Trump’s Presidency are turning out to be a somewhat unedifying affair.  Enough said.

Yet when it comes down to the returns of stock markets under different Presidents – Democrat or Republican – does it really matter who is in power?  Should we change our portfolios? Can we predict what is going to happen?  The quick answers are ‘no’, ‘no’ and ‘no’!   Take a look at the figure below which sets out the returns of the US stock market after inflation going back to Richard Nixon. There is no clear conclusion to be drawn.

Figure 1: Democrat and Republican Presidents and equity market returns


Data source: S&P500 TR Index from Morningstar Direct © All rights reserved 2020.
Note: Red = Republican and blue = Democrat.

This is perhaps not really very surprising as the price of a company’s shares is based on the future cashflows that it will deliver discounted back to a present value, using a discount rate that reflects the risks associated with that company’s cashflows.  A Presidential term is four years, but a company’s cashflows run into the distant future.  Despite the partisan nature of US politics at this time, Democrats and Republicans are all still capitalists and believe in personal freedom, property rights and, yes – even if it does not feel like it at this moment – democracy.  In a broad political sense, Democrats and Republicans are simply variations on a democratic, capitalist theme.

Active managers may try to position portfolios to reflect world events, but crystal ball gazing is hard to do.  There was much talk of the ‘blue wave trade’ prior to the election to position for a Democrat clean sweep of all parts of government yet look how that seems to be turning out!  A few days ago, the prospect of a vaccine for Covid-19 sent airlines, banks and energy companies soaring and Zoom and other ‘lockdown’ benefiters, such as Ocado, down.  Random events and the release of new information moves the market’s view of cashflows and discount rates resulting in the movement of stock prices.  Guessing against randomness is hard but taking on the known risk that equity returns are far less certain than holding cash, rewards investors who ignore this short-term noise and focus on the long-term.  The choice of the US President is important to some, but to the long-term investor it is largely irrelevant from an equity market perspective.

Risk warnings

This article is distributed for educational purposes and should not be considered investment advice or an offer of any security for sale. This article contains the opinions of the author but not necessarily the Firm and does not represent a recommendation of any particular security, strategy, or investment product.  Information contained herein has been obtained from sources believed to be reliable but is not guaranteed.

Past performance is not indicative of future results and no representation is made that the stated results will be replicated.

Past financial performance is no guarantee of future results.

Use of Morningstar Direct© data

© Morningstar 2020. All rights reserved. The information contained herein: (1) is proprietary to Morningstar and/or its content providers; (2) may not be copied, adapted or distributed; and (3) is not warranted to be accurate, complete or timely. Neither Morningstar nor its content providers are responsible for any damages or losses arising from any use of this information, except where such damages or losses cannot be limited or excluded by law in your jurisdiction. Past financial performance is no guarantee of future results.

Negative interest rates

Negative interest rates

Today, government bond yields and bank deposit rates sit very substantially – and uncomfortably – below where they were 5 and 10 years ago, in negative after-inflation terms and more-or-less-zero before inflation terms.  In March this year, the UK Government issued its first negative-yielding gilt borrowing £3.8 billion at -0.003% for a 3-year maturity.  In other words, they are getting paid to borrow money by investors! What a strange world we live in today.

On a retail basis, falling yields are evidenced in the NS&I products on offer from the UK government.  The days of Index-linked certificates at RPI + 1%, seem like Nirvana.  The recent slashing of rates across the board on NS&I products leaves savers struggling to cover the erosion of their cash by inflation.

Figure 1: NS&I rates since 2008

  2008 2013 2020
Income bonds 4.7% 1.75% 0.01%
Index-linked* RPI+1% (2009) RPI+0.15% RPI+0.01%
Premium bonds 3.4% 1.3% 1.0%

Note: Highest rate used, where interest rate steps up by assets. *Not available except for roll-over since 2003. Source: NS&I

The Bank of England – alongside other central banks – has hinted that negative interest rates remain in its arsenal of tools to help the economy.  Denmark has already seen home loan offers at a negative interest rate, meaning that mortgage borrowers pay back less than they borrow! One can perhaps see why the ‘Old Lady’[1] sees this as a useful stimulant in helping firms and consumers to have the confidence to borrow. However, if commercial banks are charged for placing deposits with the Bank of England then, in all likelihood, they will pass these costs onto retail depositors.

In effect, negative interest rates represent a transfer from savers to borrowers. However, there would appear to be limitations to negative rates as banks and individuals might well decide to hold bank notes instead at no cost if negative interest rates persist.

One possible solution is to run a system of dual interest rates[2]. Specifically, this could be targeted at one rate for bank lending (e.g. -1%) and one for bank deposits (e.g. +0.5%).  Various terms and conditions could be applied, such as directing the type of lending the banks could do with this facility.  It has even been suggested that this could be used to drive a new ‘green deal’ where money would be available to companies focused on sustainability.  Borrowers’ net income would rise, as would the benefits of greater economic stimulus through lending to companies to invest in projects.  At the very least, this is an interesting concept.

The one thing that is certain is that it will be extremely hard to preserve the purchasing power of cash in the coming months and possibly years.  Having enough cash to meet emergency liquidity needs is important, but make sure that any longer longer-term assets are sensibly invested.

Risk warnings

This article is distributed for educational purposes and should not be considered investment advice or an offer of any security for sale. This article contains the opinions of the author but not necessarily the Firm and does not represent a recommendation of any particular security, strategy, or investment product.  Information contained herein has been obtained from sources believed to be reliable but is not guaranteed.

Past performance is not indicative of future results and no representation is made that the stated results will be replicated.

Past financial performance is no guarantee of future results.

[1]    See the following link for an explanantion how the Bank of England got its nickname: www.bankofengland.co.uk/knowledgebank/who-is-the-old-lady-of-threadneedle-street

[2]    Eric Lonergan, Megan Greene, 03 September 2020, Dual interest rates give central banks limitless fire power. https://voxeu.org/

C19 BUSINESS UPDATE

WINTER ECONOMY PLAN
Here are the headlines from the Chancellors statement in Parliament on 24th September 2020 where a series of measures to help jobs and businesses were announced.

NEW JOB SUPPORT SCHEME ANNOUNCED
Chancellor Rishi Sunak announced a new job scheme starting 1 November 2020 to replace the current Job retention (“furlough”) scheme which ends 31 October 2020.

All small and medium-sized businesses are eligible, larger businesses must show their turnover has fallen during the pandemic. Employers can use the new scheme even if they have not previously used the furlough scheme. The new Government scheme will last for six months to 30 April 2021 and to be eligible employees will need to be working a minimum of 33% of their hours. For the remaining hours not worked the Government and employer will pay one third of wages each.

This means: Employers will continue to pay the wages of staff for the hours they work – but for the hours not worked, the government and the employer will each pay one third of their equivalent salary. Employees who can only go back to work on shorter time will still be paid two thirds of the hours for those hours they can’t work. The level of grant will be calculated based on employee’s usual salary, capped at £697.92 per month.

By way of an example an employee working 33% of their hours will receive at least 77% of their pay, 22% paid by the Government and 55% paid by their employer (the “worked” 33% plus 22%).

SELF-EMPLOYED INCOME SUPPORT SCHEME
The existing self-employed grant (SEISS) will also be extended on the same basis as the job support scheme. An initial taxable grant will be provided to those who are currently eligible for SEISS and are continuing to actively trade but face reduced demand due to coronavirus. The initial lump sum will cover three months’ worth of profits for the period from November to the end of January next year. This is worth 20% of average monthly profits, up to a total of £1,875.

An additional second grant, which may be adjusted to respond to changing circumstances, will be available for self-employed individuals to cover the period from February 2021 to the end of April.

VAT CUT FOR HOSPITALITY SECTOR CONTINUES
The reduction in VAT to 5% for the hospitality and tourism sector will be extended until 31 March 2021.

DEFERRAL OF VAT BILLS
Up to half a million businesses who deferred their VAT bills will be given more breathing space through the New Payment Scheme, which gives them the option to pay back in smaller instalments. Rather than paying a lump sum in full at the end March next year, they will be able to make 11 smaller interest-free payments during the 2021-22 financial year.

SELF-ASSESSMENT TAXPAYERS – TIME TO PAY EXTENSION
Approximately 11 million self-assessment taxpayers will be able to benefit from a separate additional 12-month extension from HMRC on the “Time to Pay” self-service facility, meaning payments deferred from July 2020, and those due in January 2021, will now not need to be paid until January 2022.

BOUNCE BACK LOANS – FLEXIBILITY GIVEN TO PAY BACK AMOUNTS BORROWED
More than a million businesses who took out a Bounce Back Loan will get more repayment time through a new Pay as You Grow flexible repayment system.

This includes extending the length of the loan from six years to ten, which will cut monthly repayments by nearly half. Interest-only periods of up to six months and payment holidays will also be available to businesses. The Government also intends to give Coronavirus Business Interruption Loan Scheme lenders the ability to extend the length of loans from a maximum of six years to ten years if it will help businesses to repay the loan. The chancellor also announced an extension in applications for the government’s coronavirus loan schemes until the end of November.

Further guidance will be issued in due course.

See: https://www.gov.uk/government/news/chancellor-outlines-winter-economy-plan


Cash dividends: don’t bank on them

‘Do you know the only thing that gives me pleasure? It’s to see my dividends coming in.’

To this day we can still relate to the words of American industrialist John D. Rockefeller, despite their utterance over a century ago. Be it a privately owned business or publicly listed stock, dividends come part and parcel with owning a portion of a business. Cash dividends have long been an effective tool used to attract investors to a company’s shares. ‘A bird in the hand is worth two in the bush’.

Dividends have historically been a way to disseminate information. A change in a company’s dividend could hint at financial health. In a world becoming increasingly dominated by information, mostly available at our fingertips, the power of the dividend, from this perspective at least, has diminished. Also, corporate finance departments have tools at their disposal, such as share buybacks, that have become increasingly popular.

Such phenomena, in addition to perhaps a shift in investor sentiment, have resulted in a reduction in the number of firms paying regular cash dividends to shareholders. The volume of dividends, however, has not necessarily decreased meaning that dividends are concentrated in a smaller number of companies. Dividend-targeting strategies, therefore, tend to be less diverse[1].

‘Do lower dividends mean lower returns?’

Not necessarily. Once a stock goes ex-dividend, it’s price decreases by the amount of the dividend, ceteris paribus. Not issuing a dividend would mean the cash remains in the company and thus is still part of the shareholder’s claim on assets.

Figure 1: Illustration of the impact of a dividend on stock price

Source: Albion Strategic Consulting

‘Does it matter to me what my portfolio yields from dividends?’

Not really. We adopt what is called a ‘total return’ approach to investing[2]. We are agnostic to companies’ dividend policy and instead structure diversified portfolios with a focus on risk exposures. Your portfolio will usually generate some income from dividends each year, and sometimes some capital appreciation too. However, as figure 1 demonstrated, it doesn’t matter where that return comes from. One does not draw out cash, stare at two £20 notes and wonder: ‘which of these came from dividends and which from capital appreciation?’. Return, is return, is return.

Risk warnings

This article is distributed for educational purposes and should not be considered investment advice or an offer of any security for sale. This article contains the opinions of the author but not necessarily the Firm and does not represent a recommendation of any particular security, strategy, or investment product.  Information contained herein has been obtained from sources believed to be reliable but is not guaranteed.

Past performance is not indicative of future results and no representation is made that the stated results will be replicated.

[1] Fatemi, A. & Bildik, R., (2012). “Yes, dividends are disappearing: Worldwide evidence,”

[2] For investors not requiring a ‘natural yield’ from the portfolio.

Good things come… … to those who wait

Good things come to those who wait. This was the strapline once used by Guinness to refer to the 119.5 seconds it takes to pour a ‘perfect’ pint of their iconic stout[1]. In investing, the time periods we are concerned about are measured in years, rather than seconds. Looking at your investment portfolio too often only increases the chance that you will be disappointed. This of course can be challenging at times, particularly during tumultuous markets.

We can see from the figure below that monitoring markets on a monthly basis looks rather stressful, as they yoyo through time. Green areas represent times during which the market is growing its purchasing power (i.e. beating inflation) and red areas when it is contracting.

Figure 1: Monthly real growth/contraction of global equities, Jan-88 to Jun-20

Data source: Morningstar Direct © All rights reserved. MSCI World (net div.) net of UK CPI, before charges. Dividends reinvested.

The evident month-on-month noise captured by the figure above is a consequence of new information being factored into prices on an ongoing basis. Investors around the world digest this information, decide whether it will cause a change in a company’s cashflows (or the risks to them occurring), and hold or trade the stock accordingly. These are the concerns of active investors casting judgements on individual stocks’ prospects.

Over longer holding periods, the day-to-day worries of more actively managed portfolios are erased, as equity markets generate wealth over the longer term. The figure below illustrates that monthly rolling 20-year holding periods has never resulted in a destruction of purchasing power. A longer-term view to investing enables individuals to spend more time focusing on what matters most to them and to avoid the anxiety of watching one’s portfolio movements.

Figure 2: Monthly rolling 20-year real growth/contraction of global equities, Jan-88 to Jun-20

Data source: Morningstar Direct © All rights reserved. MSCI World (net div.) net of UK CPI, before charges. Dividends reinvested.

This is not to say that investing is a set-and-forget process, however. The Investment Committee meets regularly on your behalf to kick the tyres of the portfolio, after reviewing any new evidence. Over time there may be incremental changes to your investments (there may not!) as a result, but the Committee shares the outlook illustrated in the figure above – we have structured your portfolio for the long term, and it is built to weather all storms.

Delving deeper

The figure below provides longer term market data in the US back to 1927. The result is the same. The cherry-picked 20-year example provided towards the bottom of the figure shows a time fresh in many investors’ minds: the bottom of the Credit Crisis. In this (extreme) 20-year period, to Feb-09, equity markets had barely recovered from the crash of technology stocks in the early 00s, before falling over 50% in 2008/9, in real terms. These were scary times.

Despite the headwinds, investors had been rewarded substantially for participating in the growth of capital markets over the longer term. An equity investor viewing their portfolio for the first time in 20 years would have seen their wealth more than double, whilst at the same time the media was reporting headlines such as ‘Worst Crisis Since ‘30s, with No End Yet in Sight’[2].

Have faith in wealth-creation through capitalism and try not to look at your portfolio too often. As the adage goes: ‘look at your cash daily if you need to, your bonds once per year, and stocks every ten’.

Figure 3: Long term US stock market growth in purchasing power

Data source: Morningstar Direct © IA SBBI US Large Stock Infl Adj TR Ext in USD. Market events: https://eu.usatoday.com/

Risk warnings

This article is distributed for educational purposes and should not be considered investment advice or an offer of any security for sale. This article contains the opinions of the author but not necessarily the Firm and does not represent a recommendation of any particular security, strategy, or investment product.  Information contained herein has been obtained from sources believed to be reliable but is not guaranteed.

Past performance is not indicative of future results and no representation is made that the stated results will be replicated.

Use of Morningstar Direct© data

© Morningstar 2020. All rights reserved. The information contained herein: (1) is proprietary to Morningstar and/or its content providers; (2) may not be copied, adapted or distributed; and (3) is not warranted to be accurate, complete or timely. Neither Morningstar nor its content providers are responsible for any damages or losses arising from any use of this information, except where such damages or losses cannot be limited or excluded by law in your jurisdiction. Past financial performance is no guarantee of future results.

[1] https://www.guinness-storehouse.com/en/guinness-academy

[2] Wall Street Journal, September 18, 2008

The Big Five

Investors love good stories. In recent years, many of these stories have centered around innovations that have fundamentally changed the way we live our lives. Some examples might include the release of the original Apple iPhone in 2007, the delivery of Tesla’s first electric cars in 2012[1] and the launch of Amazon Prime’s same-day delivery service in 2015[2]. No doubt, many of you will have had conversations with friends and family around the successes, failures, and prospects of some of the world’s largest firms and the goods and services they offer. In this note, we take a deeper look at the ‘Big Five’ tech companies – Amazon, Apple, Alphabet (Google), Facebook and Microsoft – through the lens of the long-term investor.

In what has been a turbulent year thus far, some larger firms have come through the first – and hopefully last – wave of the ongoing pandemic relatively unscathed. Those investors putting their nest eggs entirely in any combination of the ‘Big Five’ would appear to have done astonishingly well relative to something sensible like the MSCI All-Country World Index, which constitutes 3,000 of the world’s largest firms[3]. At time of writing, Amazon’s share price has faired best, increasing 75% since the beginning of the year.

Figure 1: The ‘Big Five’ have held up well so far this year

Data source: Morningstar Direct © All rights reserved. Returns in GBP from 01/01/2020 to 22/07/2020. [4]

These types of firms tend to struggle to stay out of the headlines for one reason or another. Perhaps as a result, many of the investment funds found in ‘top buy’ lists – such as the one on AJ Bell’s Youinvest platform[5] – have overweight positions in one or more of these stocks. The final column in the table below shows the weight of each ‘Big Five’ stock as it stands in the MSCI All-Country World Index. If an investor were to adopt a purely passive investment strategy that owned each company as its proportional share of the world market, the final column would be that investor’s top 5 portfolio holdings at time of writing. Many of todays most popular funds are making big bets on one or more of these companies, anticipating that the past will repeat itself moving forwards.

Table 1: AJ Bell’s top traded funds in the past week

Data source: Morningstar Direct © All rights reserved. AJ Bell for top traded funds between 15/07/20 – 22/07/20.

Sticking to the long-term view

The challenge for these managers, and others making similarly large bets, is that these are portfolios that will be needed to meet the needs of individuals over lifelong investment horizons, which for the vast majority of people means decades, not years. With the benefit of hindsight, managers who have placed their faith in these firms have stellar track records since Facebook’s IPO in 2012, as the table below highlights.

Table 2: ‘Big Five’ performance since Facebook’s IPO

Microsoft Corp Apple Inc Amazon.com Inc Facebook Inc A Alphabet Inc A MSCI ACWI Index
Annualised return 34% 26% 41% 32% 25% 12%
Growth of £1 £944 £534 £1,514 £855 £524 £158
Founded 1975 1976 1994 2004 1998

Data source: Morningstar Direct © All rights reserved. Returns from Jun-12 to Jun-20.

An interesting exercise would be to investigate the outcomes of these firms over a longer period of time, for example 30-years seems more prudent. This is somewhat difficult given that 30-years ago, 3 of these firms did not exist, Mark Zuckerberg was 6-years old, Apple came in at 96th on Fortune’s 500 list of America’s largest firms[6] and Microsoft had just launched Microsoft Office[7].

A partial solution to this problem is to perform the exercise from the perspective of an investor in 1996, which is the start of Financial Times’ public market capitalisation record[8]. The ‘Class of 96 Big Five’ consisted of General Electric, Royal Dutch Shell, Coca-Cola, Nippon Telegraph and Telephone and Exxon Mobil. The chart below shows the outcomes of each firm over the past 26-years. A hypothetical investor with their assets invested in either Coca-Cola or Exxon would have just about beaten the market over this period, those in Royal Dutch Shell, Nippon Telegraph and Telephone and General Electric were not so lucky. This experiment is illustrative only, one look at the chart below is enough to see that almost no investor would want to stomach the roller coaster ride they would have been on in any one of these single-stock portfolios.

Figure 2: The winners do not necessarily keep winning

Data source: Morningstar Direct © All rights reserved.

Summary

The beauty of the approach you have adopted is that judgemental calls such as these are left to the aggregate view of all investors in the marketplace. No firm is immune to the risks and rewards of capitalism; be it competition from Costco or Walmart taking some of Amazon’s market share, publishing laws causing Facebook to apply heavy restrictions on its users or some breakthrough smartphone entering the marketplace that is years ahead of Apple – remember Nokia? Rather than supposing that firms who have done well recently will continue to do well, systematic investors can rest easy knowing that they will participate in the upside of the next ‘Big Five’, the ‘Big Five’ after that and each subsequent ‘Big Five’. Those who can block out the noise of good stories and jumping on bandwagons are usually rewarded in this game.

“But the problem that people don’t understand is that active managers, almost by definition, have to be poorly diversified. Otherwise, they’re not really active. They have to make bets. What that means is there’s a huge dispersion of outcomes that are totally consistent with just chance. There’s no skill involved in it. It’s just good luck or bad luck.”
Eugene Fama – Nobel laureate

Figure 3: Your eggs are in many baskets

Source: Albion Strategic Consulting. For demonstrative purposes only.

Risk warnings

This article is distributed for educational purposes and should not be considered investment advice or an offer of any security for sale. This article contains the opinions of the author but not necessarily the Firm and does not represent a recommendation of any particular security, strategy, or investment product.  Information contained herein has been obtained from sources believed to be reliable but is not guaranteed.

Past performance is not indicative of future results and no representation is made that the stated results will be replicated.

Use of Morningstar Direct© data

© Morningstar 2020. All rights reserved. The information contained herein: (1) is proprietary to Morningstar and/or its content providers; (2) may not be copied, adapted or distributed; and (3) is not warranted to be accurate, complete or timely. Neither Morningstar nor its content providers are responsible for any damages or losses arising from any use of this information, except where such damages or losses cannot be limited or excluded by law in your jurisdiction. Past financial performance is no guarantee of future results.

[1] The Mercury News (2012) https://www.mercurynews.com/2012/06/22/tesla-motors…

[2] Wired (2015) https://www.wired.com/2015/05/free-day-delivery-amazons-gambit-retail/

[3] MSCI (2020) MSCI World Factsheet. https://www.msci.com/documents/10199/149ed7bc-316e-4b4c-8ea4-43fcb5bd6523

[4] The Guardian (2020) https://www.theguardian.com/technology/2020/jul/21/jeff-bezos…

[5] AJ Bell (2020) Top traded funds. https://www.youinvest.co.uk/funds

[6] Fortune 500 (2020) Fortune’s list of America’s largest corporations

[7] Allan R. (2001) A History of the Personal Computer

[8] Financial Times (1996) Market capitalisation record.

Second Self-Employed Income Support Grants to be Paid in August

On 29 May the Chancellor announced that the grant scheme to support the self-employed would also be extended with a further payment based on 70% of average profits for the 3 years ended 2018/19, limited to £6,570 rather than £7,500.

The eligibility criteria remain broadly the same as the first grant claim. Self-employed profits in 2018/19 must not exceed £50,000 and must be more than 50% of your total income.

If that test is not met, then the same £50,000 and 50% tests are applied to average profits and total income over the three years (or shorter period) to 5 April 2019.

Self-employed traders need not have claimed a grant under the old scheme to qualify for the August payment and are required to confirm that their business continues to be adversely affected by Covid-19. The deadline for making a claim for a grant under the original SEIS scheme is 13 July 2020.

Self-Employment Income Support Scheme (SEISS)

This week HMRC will start contacting self-employed people who are likely to be eligible, through a combination of emails, SMS texts and letters, to tell them what they need to do to get ready to claim.  Applications will open in tranches based on the unique taxpayer number (UTR) given to all self-employed taxpayers.

From this week, people will be able to use a new online eligibility checker. If the checker confirms that they are eligible (and they qualify due to being affected by coronavirus and because they intend to continue trading), they will be given a date when they can use the online service to make a claim from 13 May.

Payments will be made to claimants’ bank accounts from 25 May 2020 (ahead of the original June schedule)

Self Employed Income Support Scheme Eligibility checker see: https://www.tax.service.gov.uk/self-employment-support/enter-unique-taxpayer-reference

 HMRC have issued some more details relating to the claims for the Self-Employed Income Support. The latest guidance was issued on 1 May.

Details are in the link highlighted below.

As with many HMRC “guidance notes” issued recently, these tend to be quite basic, and, unfortunately, leave many questions unanswered.

It is hoped that HMRC may rethink the method of claim, but at this moment, the latest guidance clearly states: “Your tax agent cannot make the claim for you”, meaning we cannot apply on your behalf.

The guidance goes on to indicate that you will require: –

  • Your Self-assessment Unique Taxpayer Reference Number
  • Your National Insurance Number
  • Your Government Gateway ID and Password
  • Bank account number and sort code for payment

Contact us if you are unable to locate 1 or 2 above. However, the biggest issue is likely to be item 3.

IF YOU KNOW YOUR GOVERNMENT GATEWAY ID AND PASSWORD YOU DO NOT NEED TO TAKE ANY ACTION AT THIS TIME.

IF YOU DO NOT KNOW OR DON’T HAVE A GOVERNMENT GATEWAY ID AND PASSWORD WE RECOMMEND YOU APPLY AS SOON AS POSSIBLE TO AVOID DELAYS IN RECEIVING PAYMENT. YOU MAY BE ABLE TO SUBMIT A PAPER CLAIM (FULL DETAILS NOT YET PUBLISHED) BUT THIS WILL ALSO LEAD TO DELAYS IN PAYMENT.

Details on the application process are set out below. This will take a few days before it is ready.

If you need any assistance please contact us as soon as possible.

https://www.gov.uk/guidance/claim-a-grant-through-the-coronavirus-covid-19-self-employment-income-support-scheme