Monthly Archives

August 2020

Cash dividends: don’t bank on them

‘Do you know the only thing that gives me pleasure? It’s to see my dividends coming in.’

To this day we can still relate to the words of American industrialist John D. Rockefeller, despite their utterance over a century ago. Be it a privately owned business or publicly listed stock, dividends come part and parcel with owning a portion of a business. Cash dividends have long been an effective tool used to attract investors to a company’s shares. ‘A bird in the hand is worth two in the bush’.

Dividends have historically been a way to disseminate information. A change in a company’s dividend could hint at financial health. In a world becoming increasingly dominated by information, mostly available at our fingertips, the power of the dividend, from this perspective at least, has diminished. Also, corporate finance departments have tools at their disposal, such as share buybacks, that have become increasingly popular.

Such phenomena, in addition to perhaps a shift in investor sentiment, have resulted in a reduction in the number of firms paying regular cash dividends to shareholders. The volume of dividends, however, has not necessarily decreased meaning that dividends are concentrated in a smaller number of companies. Dividend-targeting strategies, therefore, tend to be less diverse[1].

‘Do lower dividends mean lower returns?’

Not necessarily. Once a stock goes ex-dividend, it’s price decreases by the amount of the dividend, ceteris paribus. Not issuing a dividend would mean the cash remains in the company and thus is still part of the shareholder’s claim on assets.

Figure 1: Illustration of the impact of a dividend on stock price

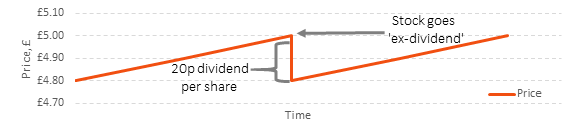
Source: Albion Strategic Consulting

‘Does it matter to me what my portfolio yields from dividends?’

Not really. We adopt what is called a ‘total return’ approach to investing[2]. We are agnostic to companies’ dividend policy and instead structure diversified portfolios with a focus on risk exposures. Your portfolio will usually generate some income from dividends each year, and sometimes some capital appreciation too. However, as figure 1 demonstrated, it doesn’t matter where that return comes from. One does not draw out cash, stare at two £20 notes and wonder: ‘which of these came from dividends and which from capital appreciation?’. Return, is return, is return.

Risk warnings

This article is distributed for educational purposes and should not be considered investment advice or an offer of any security for sale. This article contains the opinions of the author but not necessarily the Firm and does not represent a recommendation of any particular security, strategy, or investment product.  Information contained herein has been obtained from sources believed to be reliable but is not guaranteed.

Past performance is not indicative of future results and no representation is made that the stated results will be replicated.

[1] Fatemi, A. & Bildik, R., (2012). “Yes, dividends are disappearing: Worldwide evidence,”

[2] For investors not requiring a ‘natural yield’ from the portfolio.

Good things come… … to those who wait

Good things come to those who wait. This was the strapline once used by Guinness to refer to the 119.5 seconds it takes to pour a ‘perfect’ pint of their iconic stout[1]. In investing, the time periods we are concerned about are measured in years, rather than seconds. Looking at your investment portfolio too often only increases the chance that you will be disappointed. This of course can be challenging at times, particularly during tumultuous markets.

We can see from the figure below that monitoring markets on a monthly basis looks rather stressful, as they yoyo through time. Green areas represent times during which the market is growing its purchasing power (i.e. beating inflation) and red areas when it is contracting.

Figure 1: Monthly real growth/contraction of global equities, Jan-88 to Jun-20

Data source: Morningstar Direct © All rights reserved. MSCI World (net div.) net of UK CPI, before charges. Dividends reinvested.

The evident month-on-month noise captured by the figure above is a consequence of new information being factored into prices on an ongoing basis. Investors around the world digest this information, decide whether it will cause a change in a company’s cashflows (or the risks to them occurring), and hold or trade the stock accordingly. These are the concerns of active investors casting judgements on individual stocks’ prospects.

Over longer holding periods, the day-to-day worries of more actively managed portfolios are erased, as equity markets generate wealth over the longer term. The figure below illustrates that monthly rolling 20-year holding periods has never resulted in a destruction of purchasing power. A longer-term view to investing enables individuals to spend more time focusing on what matters most to them and to avoid the anxiety of watching one’s portfolio movements.

Figure 2: Monthly rolling 20-year real growth/contraction of global equities, Jan-88 to Jun-20

Data source: Morningstar Direct © All rights reserved. MSCI World (net div.) net of UK CPI, before charges. Dividends reinvested.

This is not to say that investing is a set-and-forget process, however. The Investment Committee meets regularly on your behalf to kick the tyres of the portfolio, after reviewing any new evidence. Over time there may be incremental changes to your investments (there may not!) as a result, but the Committee shares the outlook illustrated in the figure above – we have structured your portfolio for the long term, and it is built to weather all storms.

Delving deeper

The figure below provides longer term market data in the US back to 1927. The result is the same. The cherry-picked 20-year example provided towards the bottom of the figure shows a time fresh in many investors’ minds: the bottom of the Credit Crisis. In this (extreme) 20-year period, to Feb-09, equity markets had barely recovered from the crash of technology stocks in the early 00s, before falling over 50% in 2008/9, in real terms. These were scary times.

Despite the headwinds, investors had been rewarded substantially for participating in the growth of capital markets over the longer term. An equity investor viewing their portfolio for the first time in 20 years would have seen their wealth more than double, whilst at the same time the media was reporting headlines such as ‘Worst Crisis Since ‘30s, with No End Yet in Sight’[2].

Have faith in wealth-creation through capitalism and try not to look at your portfolio too often. As the adage goes: ‘look at your cash daily if you need to, your bonds once per year, and stocks every ten’.

Figure 3: Long term US stock market growth in purchasing power

Data source: Morningstar Direct © IA SBBI US Large Stock Infl Adj TR Ext in USD. Market events: https://eu.usatoday.com/

Risk warnings

This article is distributed for educational purposes and should not be considered investment advice or an offer of any security for sale. This article contains the opinions of the author but not necessarily the Firm and does not represent a recommendation of any particular security, strategy, or investment product.  Information contained herein has been obtained from sources believed to be reliable but is not guaranteed.

Past performance is not indicative of future results and no representation is made that the stated results will be replicated.

Use of Morningstar Direct© data

© Morningstar 2020. All rights reserved. The information contained herein: (1) is proprietary to Morningstar and/or its content providers; (2) may not be copied, adapted or distributed; and (3) is not warranted to be accurate, complete or timely. Neither Morningstar nor its content providers are responsible for any damages or losses arising from any use of this information, except where such damages or losses cannot be limited or excluded by law in your jurisdiction. Past financial performance is no guarantee of future results.

[1] https://www.guinness-storehouse.com/en/guinness-academy

[2] Wall Street Journal, September 18, 2008