

It is sometimes easy to forget that when markets rise and fall, we are looking at this through an aggregated, market-capitalisation weighted lens. In reality, the fortunes of individual companies and even sectors may be quite disparate over both the short and longer terms. Take a look at the figure below that illustrates just how widely dispersed US stock outcomes have been year-to-date 2023 (to the end of April). The S&P 500[1] is up by around 9% in USD terms (4% in GBP terms as Sterling has strengthened against the US dollar).
In the first quarter of 2023, the top ten contributors to performance accounted for 90% of the market rise, with Apple, Microsoft and Nvidia contributing to half of the rise. Yet in 2022 the top ten companies by size collectively fell 37% compared to the market fall of around 18%[2].
Figure 1: Individual US stock returns differ widely (YTD to 30/4/23)
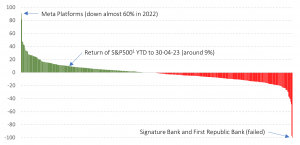
Note: (1) This represents the return of the Vanguard S&P500 ETF in USD. Holdings data from Morningstar Direct © All rights reserved.
A combination of recency and hindsight biases can tempt the unwary into thinking that it is easy to pick stocks (e.g. ‘It was obvious that Meta would rebound after last year’s plummet in share price!’). Nothing could be further from the truth.
Active investors – who aim to beat the market through their stock-picking skills – see charts like the one above and lick their lips at the opportunities they offer. Yet they are not guaranteed to beat the market, or even deliver the market return.
Passive investors on the other hand – who believe that markets work well incorporating all public information into prices – see the dangers of picking the wrong stocks and missing out on the returns that market, in aggregate, delivers. They can, more-or-less, capture the market return with a high degree of certainty.
A research paper in 2018 titled ‘Do stocks outperform treasury bills?’[3] had the remarkable effect of being claimed by both the active and passive sides of the investing debate as evidence as to why their approach is valid. He identified that the US$32 trillion of wealth created between 1926 and 2015 in the US market, was entirely generated by the top 1,000 companies, or put another way, less than 4% of the total number of companies that had existed on the US stock exchanges. A follow-up paper[4] focusing on non-US markets found that over 60% of all stocks failed to deliver a return higher than US T-bills and less than 1% of companies delivered all of the wealth creation from 1990 to 2018. The author states (in his original paper):
‘Not only does diversification reduce the variance of portfolio returns, but non-diversified portfolios are subject to the risk that they will fail to include the relatively few stocks that, ex-post, generate large cumulative returns. Indeed the results help to understand why active strategies, which tend to be poorly diversified, most often lead to underperformance.’
The challenge of structuring a highly active, concentrated portfolio to attempt to identify and capture the returns of these few wealth generating firms is immense, and at risk of both hubris and a lack of humility around the power of the collective market view (‘it’s all in the price’). The active management industry’s track record of delivering on its promise to beat the market is well-documented and extremely poor, with over 95% failing to do so over a twenty year period[5].
For those who accept that markets work, they can simply capture the market return through a low-cost, highly diversified systematic fund (of which index funds are a subset).
As the late, great John C. Bogle, the founder of Vanguard liked to say:
‘Don’t look for the needle, buy the haystack!’
Risk warnings
This article is distributed for educational purposes only and should not be considered investment advice or an offer of any security for sale. This article contains the opinions of the author but not necessarily the Firm and does not represent a recommendation of any particular security, strategy, or investment product. Reference to specific products is made only to help make educational points. Information contained herein has been obtained from sources believed to be reliable but is not guaranteed.
Past performance is not indicative of future results and no representation is made that the stated results will be replicated.
[1] This represents the return of the Vanguard S&P500 ETF in USD
[2] Nasdaq, (2023) Top 10 Names in S&P 500 Responsible for 90% of Q1 Gains, April 05. https://www.nasdaq.com/articles/top-10-names-in-sp-500-responsible-for-90-of-q1-gains
[3] Bessembinder, H. (2018) Do stocks outperform Treasury bills? Journal of Financial Economics, vol. 129, no. 3, 440–457. https://doi.org/10.1016/J.JFINECO.2018.06.004
[4] Bessembinder, H. (Hank), Chen, T.-F., Choi, G. and Wei, K.-C. (John). (2019), Do global stocks outperform US treasury bills? SSRN Electronic Journal. https://doi.org/10.2139/SSRN.3415739
[5] SPIVA | S&P Dow Jones Indices. (2022) https://www.spglobal.com/spdji/en/research-insights/spiva/spiva-library/