

By and large, behavioral science suggests that human beings make lousy investors. Whilst we are excellent problem solvers, we suffer from a whole host of well documented biases that, on average, erode the investment returns on offer from markets[1]. Being aware of our biases is a useful exercise if we are to limit the impact that they have on our decision making. In this short note, we look at both anchoring – the tendency to be influenced by a particular reference point or ‘anchor’ – and recency bias – the tendency to overemphasize the importance of more recent experiences relative to less recent ones.
Today’s capital markets are extremely well integrated, costs are low and anyone with internet access can use the power of Google (or even perhaps ChatGPT) to conduct their own research. However, historically investors have favored companies listed in their home country as opposed to those abroad. Partially this was down to the additional cost, complexity, and unfamiliarity of investing overseas, although these hurdles are relatively negligible nowadays. Even so, recent data suggest that the ‘home bias’ – the extent to which the home country is weighted in a portfolio over and above its market weight – persists.
Table 1: Investor home bias by region
| Country | Market weight | Investor weight | Home bias |
| UK | 6% | 36% | 6x |
| Australia | 2% | 52% | 26x |
| Canada | 3% | 21% | 7x |
| Japan | 34% | 8% | 4.3x |
| US | 53% | 62% | 1.2x |
Source: FTSE (2019) Appraising home bias exposure. https://content.ftserussell.com/…
Perhaps anchoring to the performance of one’s domestic market is to be expected given the above. For UK investors, the FTSE 100 measures the performance of the largest 100 firms listed in the UK and is frequently quoted in the papers and media outlets[2]. For some time, the UK has performed dismally when compared to international (ex-UK) developed markets. For example, the decade of the 2010’s saw the FTSE 100 companies return ≈75% to investors whilst international equity markets delivered a staggering ≈255% in GBP terms[3]! Since the start of 2021, the roles have reversed with the FTSE 100 delivering 31% versus 16% from international markets3.
Enter recency bias. The charts below investigate the shorter and longer period returns of the FTSE 100 and global developed equities further[4]. In the top chart, rolling annual returns show that the UK has generally lagged, although it has enjoyed a handful of 12-month periods of outperformance.
Figure 1: Rolling 12-month returns of the FTSE 100 and global equity markets
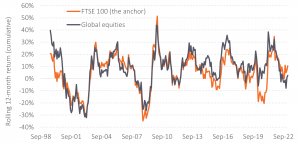
| …but these periods are lost to history |
| Biases creep in here… |
Data source: Morningstar Direct © All rights reserved. Funds: HSBC FTSE 100 Index Fund, Vanguard Global Stock Index Fund.
Zooming out to rolling 10-year periods paints a different picture. This is due to the many small periods of underperformance above compounding up to provide poorer outcomes over longer horizons, as demonstrated below.
Figure 2: Rolling 10-year returns of the FTSE 100 and global equity markets
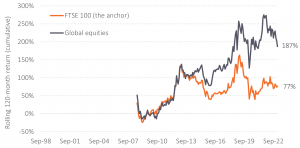
Data source: Morningstar Direct © All rights reserved. Funds: HSBC FTSE 100 Index Fund, Vanguard Global Stock Index Fund.
The point is not to suggest that the UK is some sort of anomaly, or that this level of relative underperformance is to be expected moving forwards. There are plenty of examples throughout history demonstrating exactly the opposite. The point is that getting swayed by recent performance, and perhaps anchoring to one’s domestic market, is best avoided.
Removing our performance hats and replacing them with our risk ones, there are some very sensible reasons why having too many eggs in the 100 largest companies in the UK makes little sense from an investment portfolio perspective:
- The FTSE 100 is highly concentrated with over 33% of the assets held in just the top 10 companies – the likes of Shell, HSBC and AstraZeneca being the top holdings at present.
- The FTSE 100 is materially overweight to certain sectors such as energy (12% vs 5% globally) and underweight to the point of almost not having any in terms of technology (1% vs 21% globally).
- This explains much of the recent performance differential above – where technology has struggled, energy stocks have flourished in the high-inflation environment exacerbated by the Russian invasion of Ukraine.
- Over longer periods technology stocks have dominated (Apple, Microsoft, Tesla etc.).
- The global opportunity set consists of over 10,000 companies across over 50 countries. Diversifying across them all as a starting point makes good sense and should lead to a smoother investment journey.
Be aware of that anchor and make sure that you do not get overly influenced by what has just performed well. You have no chance guessing which market will do well next. Just own the world.
[1] Nobel laureate, Daniel Kahneman, has a fantastic book called ‘Thinking, Fast and Slow’ that unpacks why we make the decision we make. It is a very accessible read for those looking for a new book! https://www.amazon.co.uk/Thinking-Fast-Slow-Daniel-Kahneman/dp/0141033576
[2] It rarely appears in headlines when things are going well, but you can be sure it will when we experience the next poor investing day/month/year. Another one – negativity bias!
[3] Funds: HSBC FTSE 100 Index Fund, Vanguard FTSE Developed World ex-UK Index Fund.
[4] Global developed equities (including UK) due to much longer track record.