

The late, great Jack Bogle – the founder of Vanguard and the grandfather of index investing – left us all with a simple mantra that he repeated almost every time he wrote an article or gave an interview ‘costs matter’. He also often used to say, ‘in investing you get what you don’t pay for’. And therein lies the rub. In day-to-day life, we tend to make a connection – largely correctly – that you get what you pay for. If you need a good lawyer, it will probably cost you. If you want the paint to last on your windows, employ a decorator who costs more because they will spend more time prepping the surfaces and uses better quality products. Buy cheap, buy twice! Yet when it comes to investing, broadly speaking, the exact opposite applies. The more you pay in ongoing charges to invest in a fund and on all the costs associated with owning the fund over time, such as those it incurs when buying or selling shares, means, on average, that there is less money left to put in your pocket. It would be easy to select a good fund if all you had to do was pick the most expensive manager, which might set you back significantly more than 1% a year. Yet we know, for example, that over 85% of all US equity funds failed to beat the market over 20 years, not least because of the high costs they incur[1]. Trying to pick – in advance – skilled managers who will beat the market in the next 20 years is extremely taxing.
In fact, if you reverse your strategy and pick the cheapest fund, it is likely (although never guaranteed) to be a better option. Taking equity funds available for sale in the UK[2] – both index funds delivering the market return (295 in all), and non-index funds (4,969) seeking to beat the market return, the average costs and the difference between them are set out below.
Figure 1: Equity funds for sale in the UK – Ongoing Charges Figure (OCF)
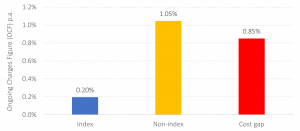
Source: Morningstar Direct © All rights reserved. Data as at 30th June 2021.
If we assume that both sets of managers (index and non-index) capture the same market returns before costs – a reasonable position to take, in aggregate, as winners and losers have to net out to zero – we can calculate the differential wealth outcomes over time between the less costly index funds and the more costly non-index funds. The seemingly small difference of 0.85% make a huge difference to what an investor’s retirement might look like. The chart below shows you how much more money you would have with the lower cost strategy over different time frames[3].
Figure 2: Wealth outcomes differ depending on costs – lower = generally better
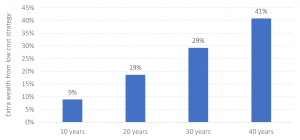
Source: Albion Strategic Consulting using Professor William Sharpe’s Terminal Wealth Ratio calculation.
Put another way, at the end of 40 years – not an unreasonable investing horizon – if the high-cost strategy ended up with £1 million, the lower cost strategy would have £410,000 more to spend, all else equal.
Perhaps we should also take heed of another investing titan, Warren Buffet of Berkshire Hatahway, who reflects on the trouble the wealthy sometimes have in buying something cheap, in this case index funds:
‘The financial “elites” – wealthy individuals, pension funds, college endowments and the like – have great trouble meekly signing up for a financial product or service that is available as well to people investing only a few thousand dollars. This reluctance of the rich normally prevails even though the product at issue is – on an expectancy basis – clearly the best choice.’
Warren Buffett (2016) Berkshire Hathaway Shareholder Letter
As investors we should not lose sight of the fact that we put up 100% of the capital and take 100% of the risk of doing so. Surely, we deserve to pocket the bulk of the returns on offer. So, all together now, one last time, ‘costs really matter!’
Risk warnings
This article is distributed for educational purposes and should not be considered investment advice or an offer of any security for sale. This article contains the opinions of the author but not necessarily the Firm and does not represent a recommendation of any particular security, strategy, or investment product. Information contained herein has been obtained from sources believed to be reliable but is not guaranteed.
Past performance is not indicative of future results and no representation is made that the stated results will be replicated.
[1] US Scorecard 2021. http://us.spindices.com/resource-center/thought-leadership/spiva/
[2] As of 30th June 2021. Open-ended, UK domiciled funds and ETF, or funds with UK reporting status, publishing KIID OCF data.
[3] This uses Nobel Laureate William Sharpe’s Total Wealth Ratio calculation